Introduction: Introduction to target package
Mahmoud Ahmed1
2020-12-16
Source:vignettes/workshop_introduction.Rmd
workshop_introduction.RmdBackground
Predicting the interaction of two factors using binding and expression data
The binding of a transcription factor to a regulatory region (e.g. gene promoter) induces or represses its expression Rougemont and Naef (2012).
Transcription factors share their binding sites with other factor, co-factors and/or DNA-binding proteins forming complexes.
The integration of the overlapping binding sites and the effect on gene expression of perturbing the factors can be used to infer their combined function; cooperative or competitive.
Modeling the binding sites as the discounted distances of the ChIP peaks
Peak Score (\(S_p\)): is the distance (\(\Delta\)) from transcription start site (TSS) relative to a 100 kb Wang et al. (2013).
\[ S_p = e^{-(0.5+4\Delta)} \]
The shape of the function approximate empirical observations Tang et al. (2011)
# define distances
d <- 1:100

# define a decay function
decay_func <- function(x) exp(-(0.5 + (4 * x/100)))

# plot decay over distances
plot(d, decay_func(d),
     pch = 19,
     xlab = 'd = 1:100', ylab = 'exp(-(0.5 + 4 * d/100))')
Modeling the regulatory potential as the sum of the weighted peaks
Gene Score (\(S_g\)): is the sum of the scores (\(S_p\)) of the \(k\) peaks nearby the TSS.
\[S_g = \sum_{i=1}^k S_{pi}\]
Regulatory potential increases with the number of binding sites Tang et al. (2011).
# define distances
d <- 1:100

# sample distances to assign genes
set.seed(123)
g <- sample(1:10, 100, replace = TRUE)

# count the number of instances
n <- as.numeric(table(g))

# aggregate the distances for each instance
s <- aggregate(d, list(g), sum)$x

# plot aggregate distances over the number of instances
plot(n, s,
     pch = 19,
     xlab = 'table(g)', ylab = 'aggregate(d, g, sum)')
Integrating the factor binding and the expression information
Rank Product (\(RP_g\)): the gene score (\(R_{gb}\)) rank is multiplied by the gene statistics rank (\(R_{ge}\)) from differential expression Breitling et al. (2004).
\[ RP_g = \frac{R_{gb}\times R_{ge}}{n^2} \]
Integrate the binding events and the functional effect Tang et al. (2011).
# define distances
d <- 1:100

# make a random stat variable
set.seed(12345)
t <- rnorm(200, 0, 5)

# calculate rank product
rp <- rank(abs(c(-d, d))) * rank(abs(t))

# get min and max ranks
pmax <- which(rp == max(rp))
pmin <- which(rp == min(rp))

# plot random stats over distances
plot(c(-d, d), t,
     pch = 19, col = 'gray',
     xlab = 'c(-d, d)', ylab = 'rnorm(200, 0, 5)')

# highlight the max rank
points(c(-d, d)[pmax], t[pmax],
       col = 'blue', pch = 19)
text(c(-d, d)[pmax]+10, t[pmax] + 1,
       col = 'blue', labels = 'Max')

# highlight the min rank
points(c(-d, d)[pmin], t[pmin],
       col = 'green', pch = 19)
text(c(-d, d)[pmin] + 10, t[pmin] + 1,
       col = 'green', label = 'Min')

# make quadrant lines
abline(h = 0, col = 'red')
abline(v = 0, col = 'red')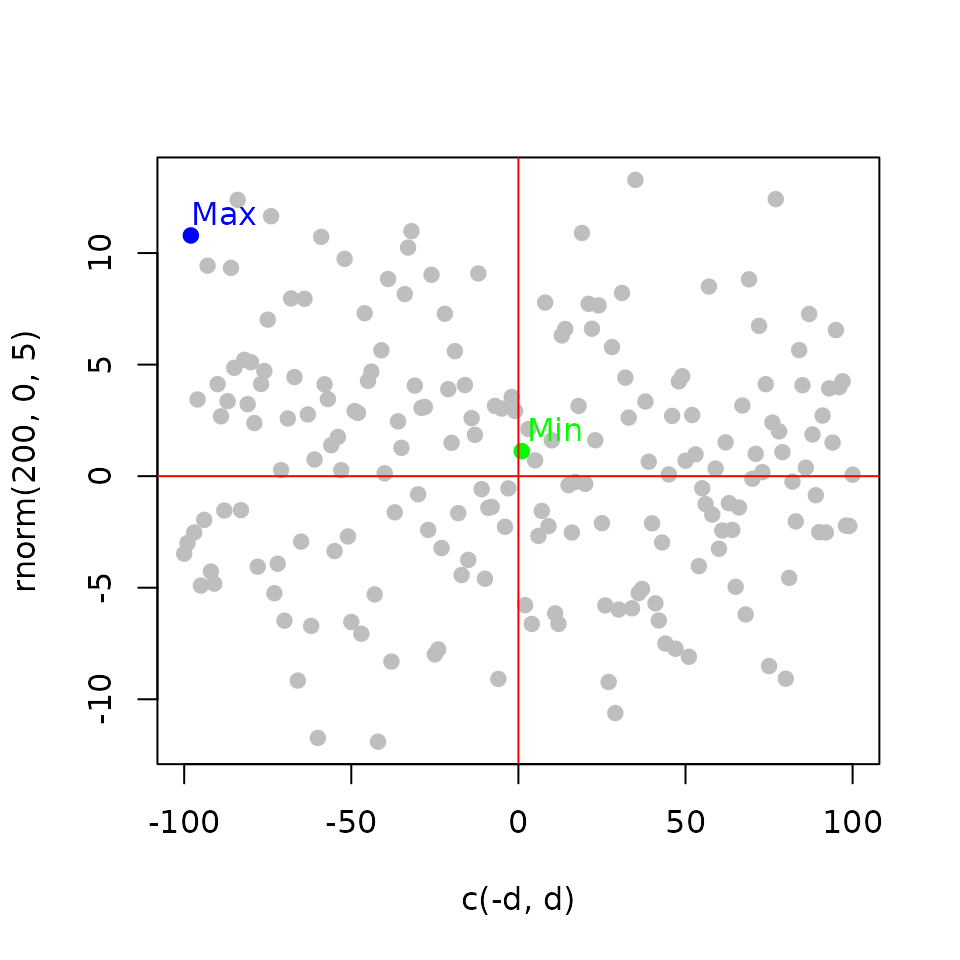
Modeling the interaction of two factors using independent perturbations
Regulatory Interaction (\(RI\)): is the product of the gene statistics from differential expression of the perturbation of the two factors (\(x\) and \(y\)) separately.
\[ RI_{g} = x_{ge}\times y_{ge} \] and,
\[ RP_g = \frac{R_{gb}\times RI_{ge}}{n^2} \]
# define two random stat variables
set.seed(12345); t <- rnorm(200, 0, 5)
set.seed(321); t2 <- rnorm(200, 0, 5)

# plot the two random stat variables
plot(t, t2, ylim = c(-10, 10),
     xlim = c(-10, 10), pch = 19, col = 'gray',
     xlab = 'rnorm(200, 0, 5)', ylab = 'rnorm(200, 0, 5)')

# highlight four quadrant by sign
text(5,5, '(+, +)', col = 'blue')
text(-5,-5, '(-, -)', col = 'blue')
text(-5,5, '(-, +)', col = 'green')
text(5,-5, '(+, -)', col = 'green')

# make quadrant lines
abline(h = 0, col = 'red')
abline(v = 0, col = 'red')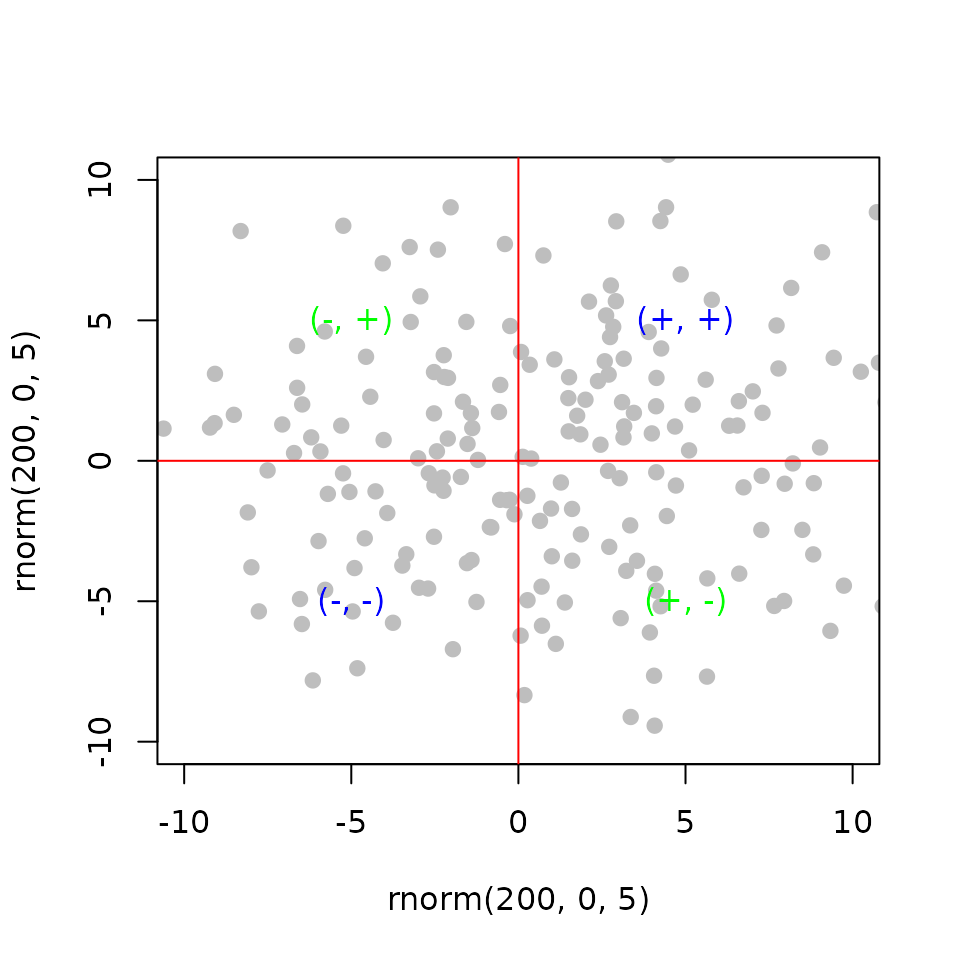
Aggregating the effect of the binding events
Empirical Cumulative Distribution Function (ECDF): the proportion of genes in a category (up- or down-regulated genes) that are ranked at or better than the x-axis (regulatory potential value) value Tang et al. (2011).
Aggregate the effect of the factor perturbation in relation to its regulatory potential.
# make a random stat variable
set.seed(12345)
t <- rnorm(200, 0, 5)

# calculate the cumulative distribution function
ecdf_fun <- ecdf(t)

# plot ecdf
plot(ecdf_fun,
     main = '', xlab = 'rnorm(200, 0, 5)', ylab = 'ECDF')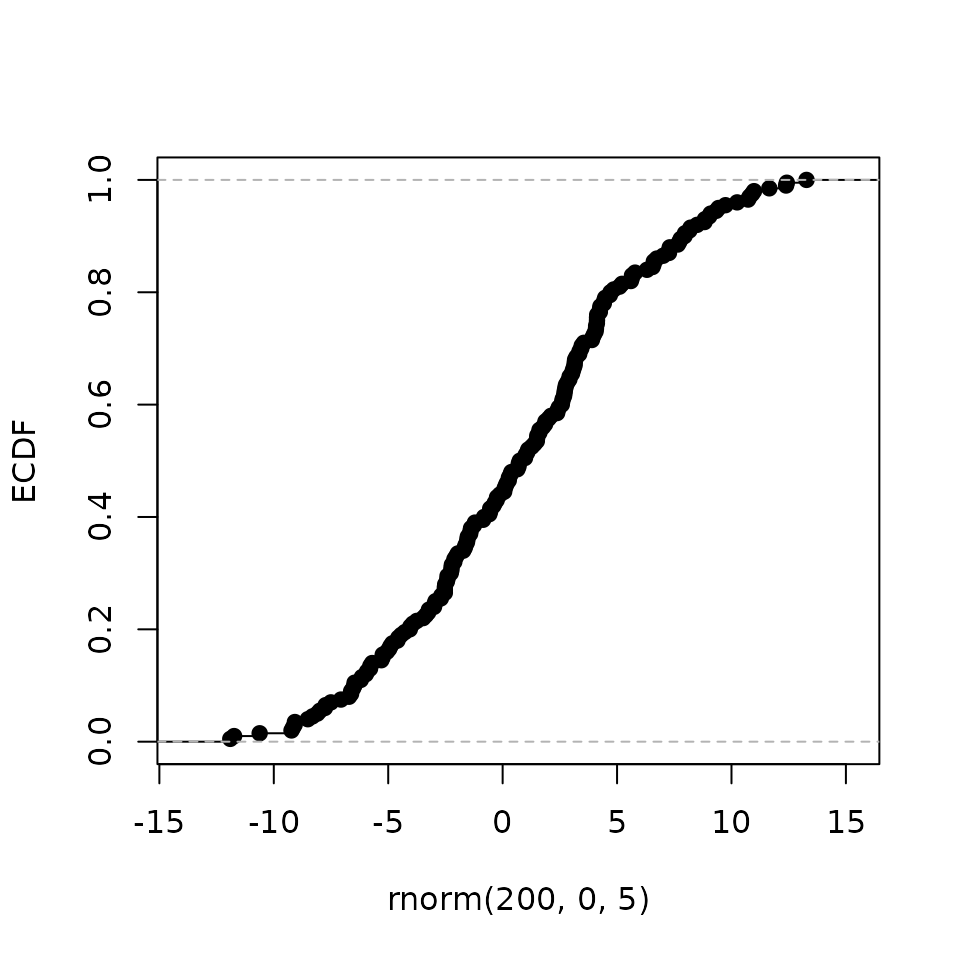

Functions in the target R package
?target::associated_peaks
?target::direct_targets
?target::plot_predictions
?target::test_predictions
Comparison with existing R packages
-
rTRMidentifies the transcriptional regulatory modules (TRMs) which are complexes of transcription factors and co-factors by integrating ChIP, gene expression and protein-protein interactions Diez, Hutchins, and Miranda-Saavedra (2013). -
TFEA.ChIPcurates large quantities of data from different sources and uses this data to build a database where queries of transcription factor targets can be constructed Puente-Santamaria, Wasserman, and Peso (2019). -
transcriptRuses the ChIP data to denovo identify transcripts which are then used to quantify the expression from the RNA-Seq data Karapetyan AR (2019).
Limitations of target
- Comparable sets of data for the two factors are required; binding data using ChIP and gene expression data under factor perturbation (overexpression or knockdown).
- Assume that the interaction between two DNA-binding proteins is linear which may not be the case always.
- Cannot detect assisted binding.
Availability
-
targetis available as an open source R/Bioconductor package, here - An interactive shiny application can be invoked locally through R or accessed directly on the web, here
- The source code for the package and the interactive application is available here
References
Breitling, Rainer, Patrick Armengaud, Anna Amtmann, and Pawel Herzyk. 2004. “Rank products: a simple, yet powerful, new method to detect differentially regulated genes in replicated microarray experiments.” FEBS Letters 573 (1-3): 83–92. https://doi.org/10.1016/j.febslet.2004.07.055.
Diez, Diego, Andrew Paul Hutchins, and Diego Miranda-Saavedra. 2013. “Systematic identification of transcriptional regulatory modules from protein-protein interaction networks.” Nucleic Acids Research. https://doi.org/10.1093/nar/gkt913.
Karapetyan AR. 2019. “An Integrative Tool for ChIP- And RNA-Seq Based Primary Transcripts Detection and Quantification.” R package. https://doi.org/10.18129/B9.bioc.transcriptR.
Puente-Santamaria, Laura, Wyeth W Wasserman, and Luis del Peso. 2019. “TFEA.ChIP: a tool kit for transcription factor binding site enrichment analysis capitalizing on ChIP-seq datasets.” Bioinformatics. https://doi.org/10.1093/bioinformatics/btz573.
Rougemont, Jacques, and Felix Naef. 2012. “Computational Analysis of Protein–DNA Interactions from ChIP-seq Data.” In Gene Regulatory Networks, 263–73. Springer. https://doi.org/10.1007/978-1-61779-292-2{\_}16.
Tang, Qianzi, Yiwen Chen, Clifford Meyer, Tim Geistlinger, Mathieu Lupien, Qian Wang, Tao Liu, Yong Zhang, Myles Brown, and Xiaole Shirley Liu. 2011. “A comprehensive view of nuclear receptor cancer cistromes.” Cancer Research 71 (22): 6940–7. https://doi.org/10.1158/0008-5472.CAN-11-2091.
Wang, Su, Hanfei Sun, Jian Ma, Chongzhi Zang, Chenfei Wang, Juan Wang, Qianzi Tang, Clifford A. Meyer, Yong Zhang, and X. Shirley Liu. 2013. “Target analysis by integration of transcriptome and ChIP-seq data with BETA.” Nature Protocols. https://doi.org/10.1038/nprot.2013.150.